Three pools of value are structurally undercounted by the headline statistics used to size this opportunity. This is where the report's own original synthesis, rather than a repackaging of public data, actually lives.
The Tata-Airbus C295 programme onboarded 37 India-based suppliers, drawn from both the private and public sector, to manufacture 13,000 of the aircraft's detail parts domestically across 21 certified special processes. The great majority of those 37 names will never appear in this report, because the great majority of them are not listed. Every export statistic and every "India aerospace market size" figure in §6 is built, in part, on capacity sitting inside companies with no public equity at all — which means the listed universe in §9 is a narrower and more concentrated slice of the real value chain than the headline numbers imply.
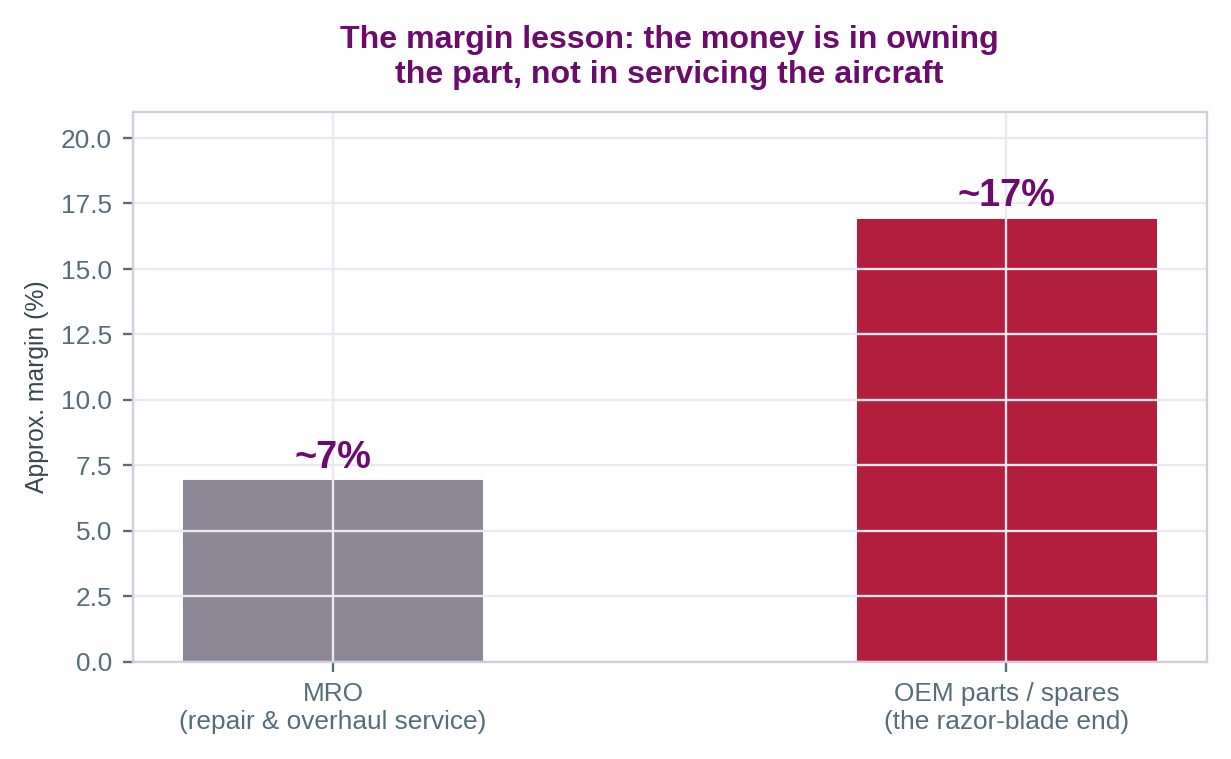
Industry-wide, MRO service margins run close to a historical ~7%, while OEM parts and spares sales run closer to ~17% — a "razor-blade" economics where the party that owns the part design captures the profit through selling the part, not through the labour of repairing it. Aftermarket revenue on any given programme only ramps meaningfully years after entry into service. A supplier winning a qualification today is booking build-to-print or early-production revenue now; the fatter-margin spares annuity that its qualification actually earns is largely still in the future, and is invisible in current-year export or revenue figures.
India's total exports under HS Code 88 (aircraft, spacecraft and parts) were US$7.07 billion in calendar 2024 (UN COMTRADE). India's total defence exports — a differently defined basket covering all defence goods, not just aerospace, and excluding civil aerospace entirely — were ₹23,622 crore (~US$2.8 billion) in FY25. These numbers are frequently quoted alongside each other as though they measure the same "India aerospace" opportunity. They do not: one includes civil aviation and excludes non-aerospace defence goods; the other does the reverse. Reading them as a single, larger number overstates the aerospace-specific opportunity; reading only the smaller figure understates the civil side entirely.
Every company report that follows should be read against this backdrop: a company's current revenue and export figures are a lagging, undercounted signal of the position it has actually built. The qualification a company won two years ago is worth more than its current P&L shows, and the MSME capacity sitting below the listed universe means the "market" this report's fourteen companies compete in is bigger, and more fragmented, than their combined market capitalisation suggests.